TeslaX
HomeFeaturesBattery AnalyticsAI AdvisorCertificateSupportDownloadالعربيةGet the app
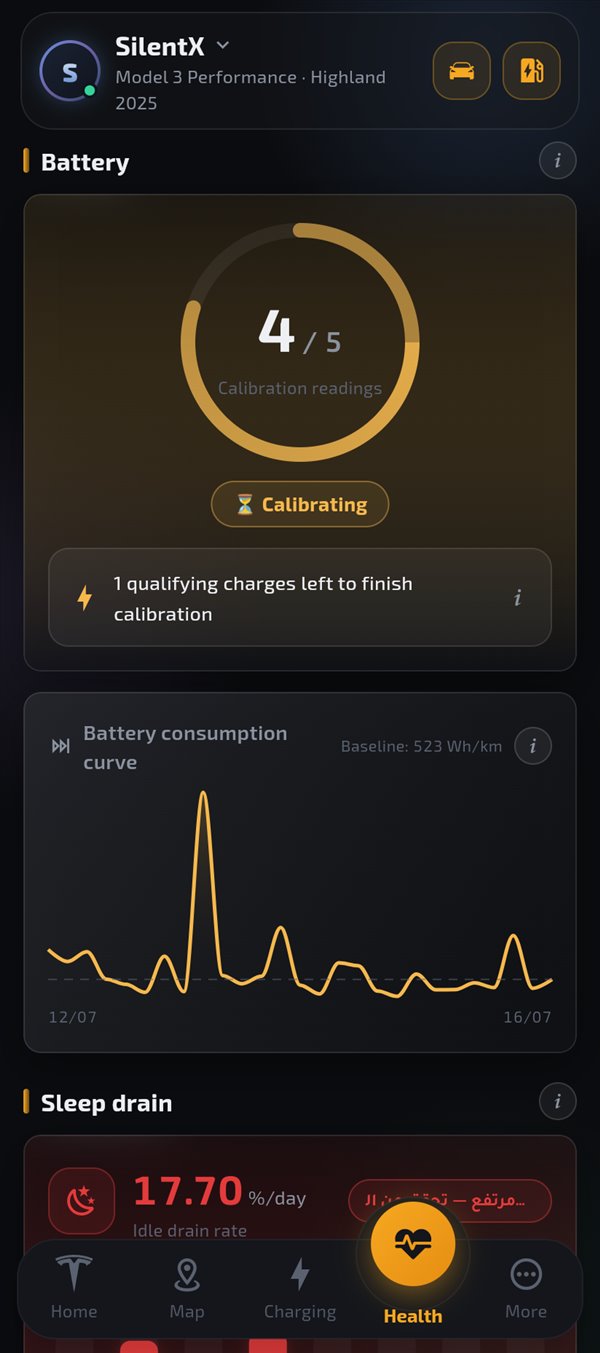
TeslaX flagship screen

Battery analytics with engineering depth

Not just a charge percentage — a full measurement system: health, capacity, degradation, consumption, idle drain, charging efficiency, plus a live BMS stream: cell balance, module temperatures and safety indicators. Built so you know your battery’s value before you have to ask.

Figures on this page are illustrative marketing samples — not a real user’s data.

Command center

Everything that matters about the battery — at a glance

A Model 3 Performance dashboard mock — showing the depth TeslaX collects.

SOH
95.2%
Excellent
ConfidenceHigh
Qualifying sessions48
90-day trendStable
Last reading2026-07-22
Battery health
96%
Current capacity
74.8 kWh
Nominal capacity
78.1 kWh
Est. degradation
4.1%
Capacity lost
3.3 kWh
Full charge range
≈ 498 km
Charging efficiency
92%
AC / DC mix
68% / 32%
Energy added
12.4 MWh
Energy used
11.1 MWh
Avg consumption
148 Wh/km
Vampire drain
0.7% day
Charge sessions
186
Measurement quality
High
Pack temperature
27 °C
Range signal
≈ 96%
Cell balance
12 mV
Est. cycles
≈ 156
Capacity & degradation

From factory capacity… to what remains usable

We compare gross and usable capacity when new with the current estimate from qualifying charge sessions — plus a per-vehicle error bound capped at 100%.

Gross (factory)
82.0 kWh
Usable (new)
78.1 kWh
Estimated now
74.8 kWh

Model 3 Performance Highland reference — marketing sample.

Consumption

Wh/km curve… against your car’s baseline

Each point is one trip. The dashed line is your median baseline. Above baseline = climate, speed or load; below = more efficient driving.

Baseline
142 Wh/km
Last 7 days
148 Wh/km
Best trip
118
Highest
196
Battery consumption curve Wh/km
Trips under 1 km excluded · marketing sample
Daily idle / vampire drain %/day
< 1% normal · 1–2% often Sentry · > 2% high
Vampire drain

How much does the pack lose while parked?

We measure daily drain with no driving or charging, and separate calm days from Sentry or connected-app days.

Avg drain
0.7%
Worst
1.9%
Calm days
5/7
Parked rate
0.9%
Measurement method

Why TeslaX goes deeper than a glance at %

Every figure has a source: qualifying AC charges, median/regression, confidence, and time trends — not a random guess.

Charge calibration

A reading from each uninterrupted home AC charge that rises ≥ 30% (e.g. 40%→75%). 5+ readings before we show a result.

Median + regression

Raw estimate from median/regression of qualifying sessions, then an optimistic bound from that vehicle’s own spread.

Confidence & quality

Low/medium/high confidence from sample count, stability and history length — plus factors like high variance or short history.

30- & 90-day trends

We separate stability from normal slow decline and sharp drops that deserve attention.

Model reference

Pack chemistry and reference capacities by model, trim and year vs the live estimate.

Certificate & report

Export a battery-health certificate and monthly PDF for sale or follow-up.

New — live from the BMS

Inside the pack… in real time

TeslaX reads the Battery Management System live over Tesla’s official stream: module temperatures, cell-group balance, pack voltage & current, the HV safety loop and isolation resistance — data that used to require diagnostic hardware.

Cell-group balance

The earliest signal of cell condition

The pack is made of series cell groups that should sit at equal voltages. A small steady spread = a balanced pack; a growing one = a group worth watching. TeslaX shows the live spread and captures a daily snapshot to chart the trend across weeks.

Spread now
12 mV
Verdict
Excellent
Highest brick
3.921 V
Lowest brick
3.909 V
Cell-balance trend — daily snapshot mV
Captured while parked and not charging — the trend matters more than any single reading · marketing sample
Temperature & safety

Watching for you — alerting before it grows

Automatic server-side health alerts: an HVIL safety-loop fault, low isolation resistance, a high cell-group voltage spread, module-temperature imbalance while charging, and a battery heater running in hot weather — pushed the moment they’re detected.

  • Module temperatures: max, min, sensor number and the delta between them.
  • The HVIL safety loop and isolation resistance in megaohms.
  • Pack voltage, current and true instantaneous power in kW.
  • Battery heater, preconditioning and full-charge completion.
  • Estimated full charge cycles from lifetime energy.
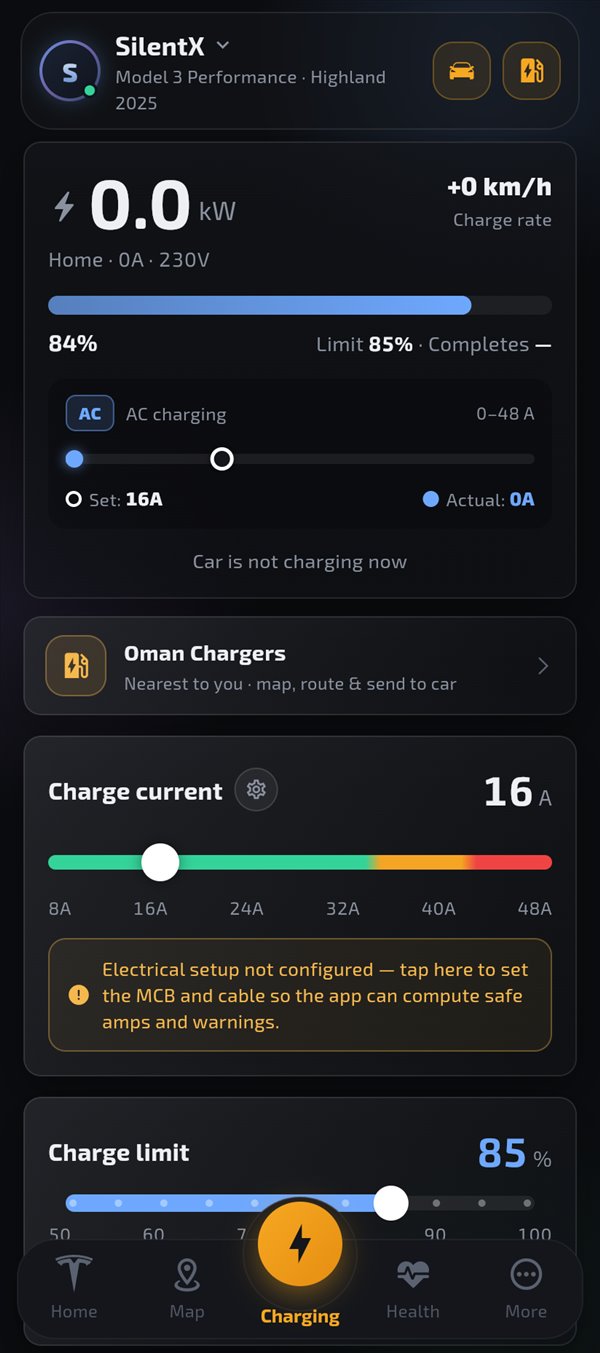
Live charging detail from the BMS AC
Charger voltage
234 V
Phases
1
Time to limit
0:54
Module temps
31–33°
Charging efficiency (charger → battery) 92%
Computed per AC session from the wall-side and battery-side energy counters, and stored with each session.
Time-to-limit comes from the car’s own computer — not an approximation

The BMS stream is available for cars connected over Fleet Telemetry (requires virtual-key pairing).
Why it matters

The battery is the most valuable part of the car

  • Know whether degradation is normal or worth a review.
  • Compare your capacity to the model/trim reference.
  • Catch vampire drain before it steals morning range.
  • Understand trip-by-trip use against your baseline.
  • Share a certificate for sale or appraisal.
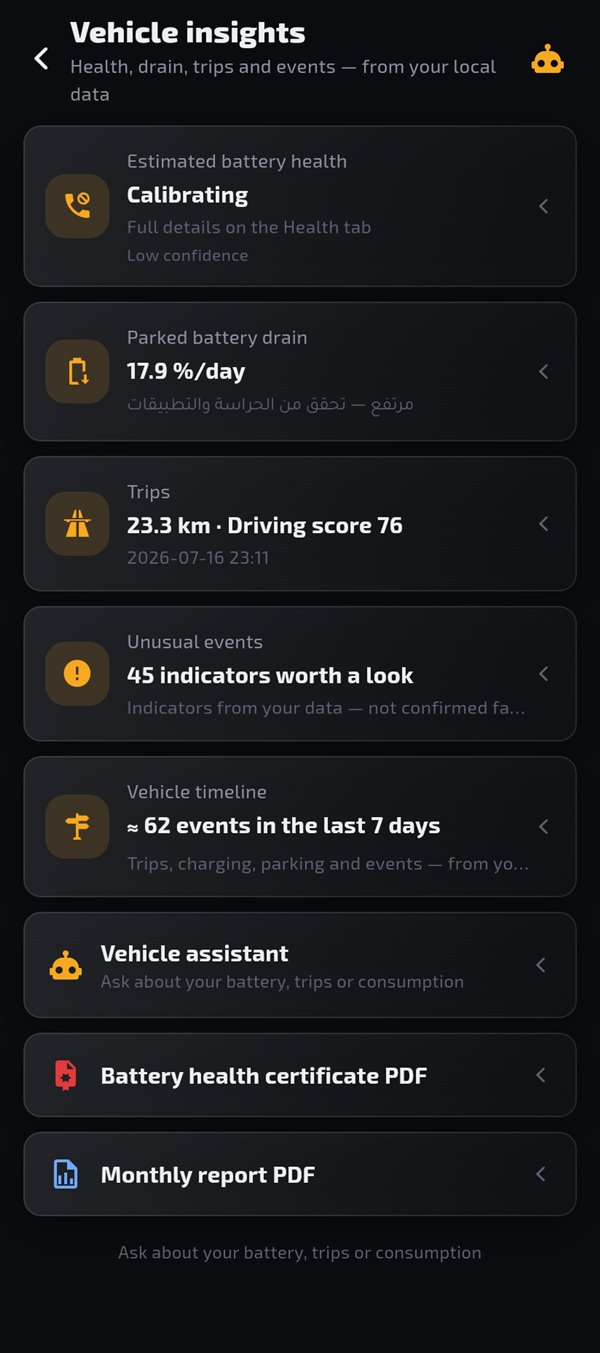
Charging screen Insights screen
Tesla Model 3 Performance

Ready to see your battery at this depth?

Download TeslaX, link via Tesla OAuth, and let calibration build itself from your home charges.

Get the app Certificate sample

All figures and charts on this page are marketing illustrations only.